Introducing our Artifacts Hub and Adoption Dashboard
What it does
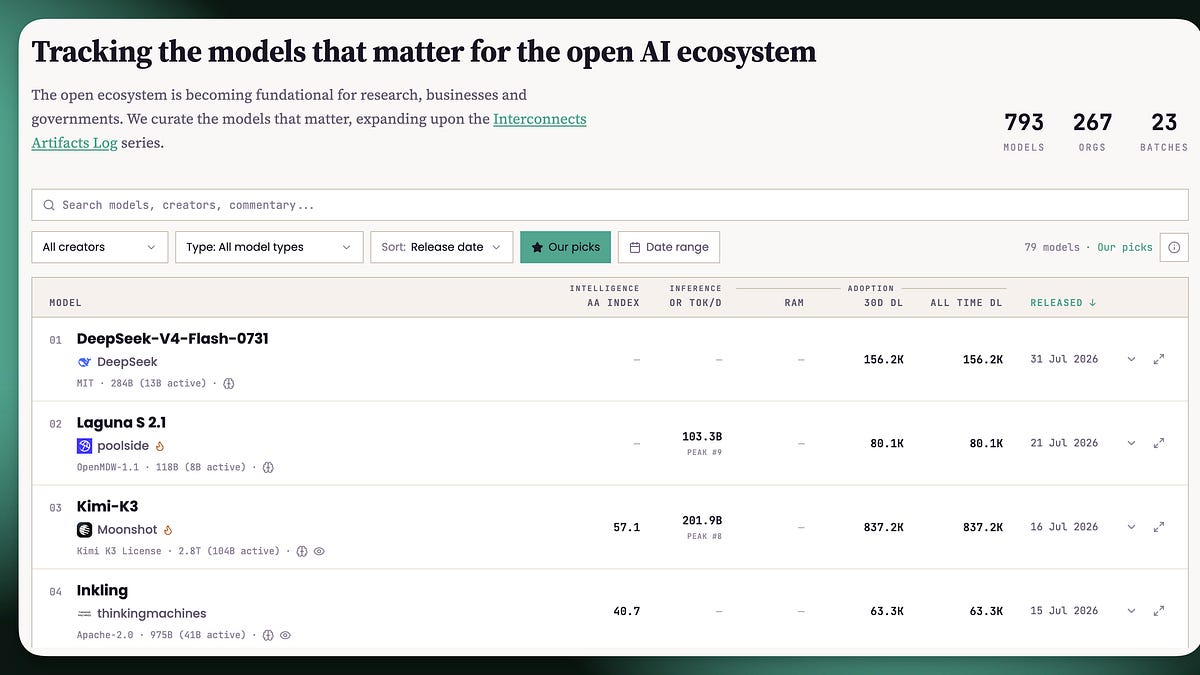
The Artifacts Hub and Adoption Dashboard are new tools designed to scale how open ecosystem projects are curated and measured. The Hub centralizes and organizes key resources, codebases, and infrastructure artifacts across multiple open networks. Meanwhile, the Adoption Dashboard provides real-time metrics to track growth, usage, and integration of these artifacts within ecosystems. Together, these tools create a streamlined way to collect, showcase, and monitor open ecosystem assets from one place.
Why it matters
Open ecosystems rely on transparency and accessible shared infrastructure to grow. The challenge has been managing the steady influx of new components and figuring out which ones actually gain traction. The Hub removes friction by making discovery and validation of artifacts easier. At the same time, the Adoption Dashboard quantifies adoption—forcing projects to prove their utility and encouraging more data-driven decisions. This pushes ecosystems toward higher quality projects with measurable impact, reducing guesswork for integrators, maintainers, and investors.
Who it is for
Builders, maintainers, and ecosystem managers benefit most. Builders get a bigger, validated stage for their components. Maintainers save time vetting contributions by accessing a curated library. Ecosystem managers gain timely insights on which technologies to support or promote. Investors and operators looking for reliable signals on project momentum will find the Adoption Dashboard’s data critical when sizing risk and opportunity in emerging open infrastructure.
The catch
The effectiveness depends on broad adoption and timely, accurate data input. If projects don’t stay engaged or fail to update their metrics, the Hub risks becoming a static repository rather than a dynamic enabler. The Dashboard’s measurement criteria will also shape which projects get attention—potentially favoring popularity over pioneering innovation. Maintaining balance between inclusivity and quality will be a key ongoing challenge.
What to watch next
Watch how quickly and widely the open ecosystem community adopts these tools and integrates them into workflows. Tracking which artifacts gain visibility and how measured metrics influence project support decisions will reveal how much this approach shifts power dynamics in open infrastructure development. The rollout and iterative improvements of the Adoption Dashboard will also show how responsive the system is to real-world operating conditions and data quality challenges.
AI Quick Briefs Editorial Desk